Community Trust Index
A measure of community trust lived in a spreadsheet that only researchers could read. We designed and built its home from scratch, with a world map, one page design for every country and four languages.
- Type
- Research platform
- Year
- 2024
- Scope
- Website design, WordPress build, interactive map and country data pages
- Languages
- English, French, Spanish and Portuguese
- Live site
- trust.communityengagementhub.org ↗
New site and wireframes
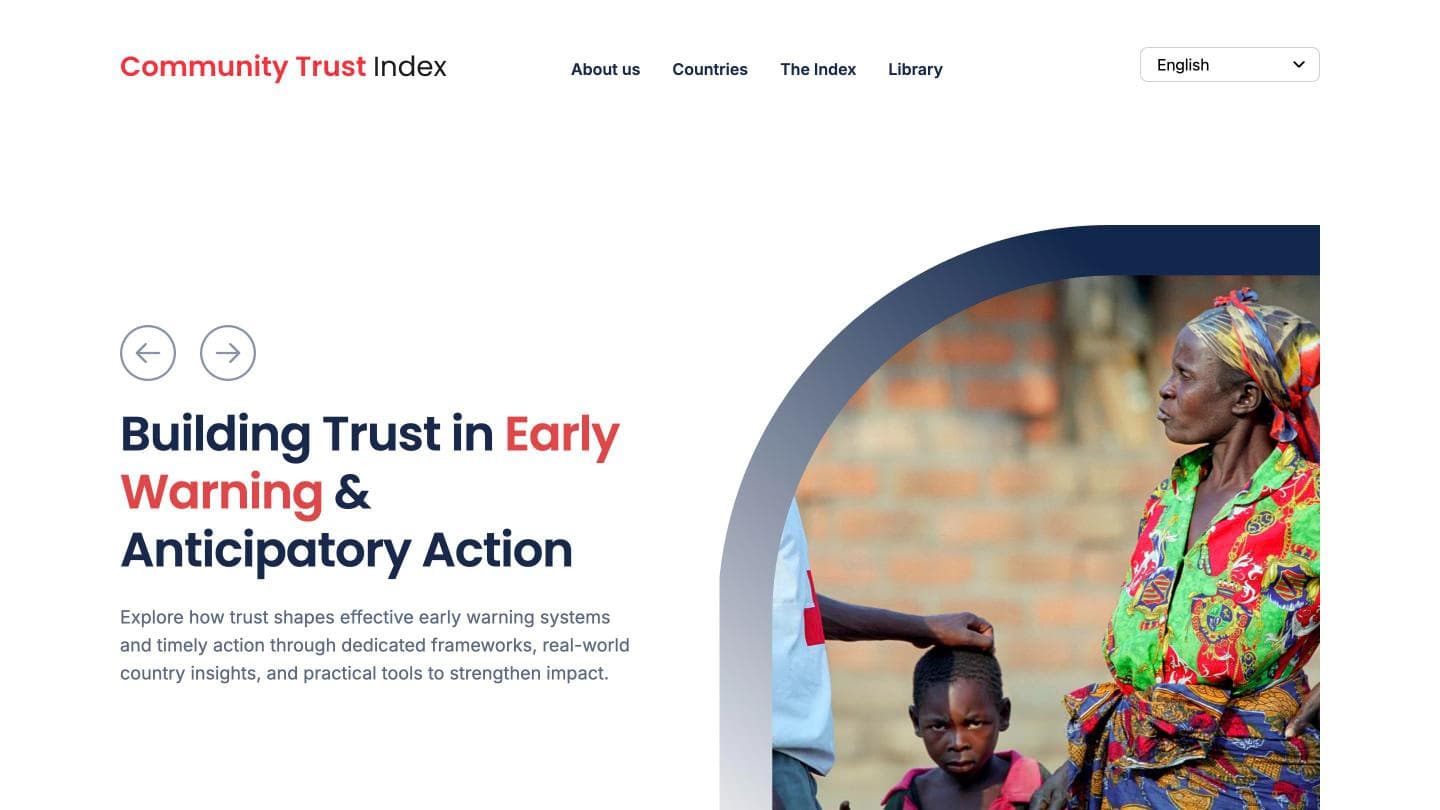
 New site · Home
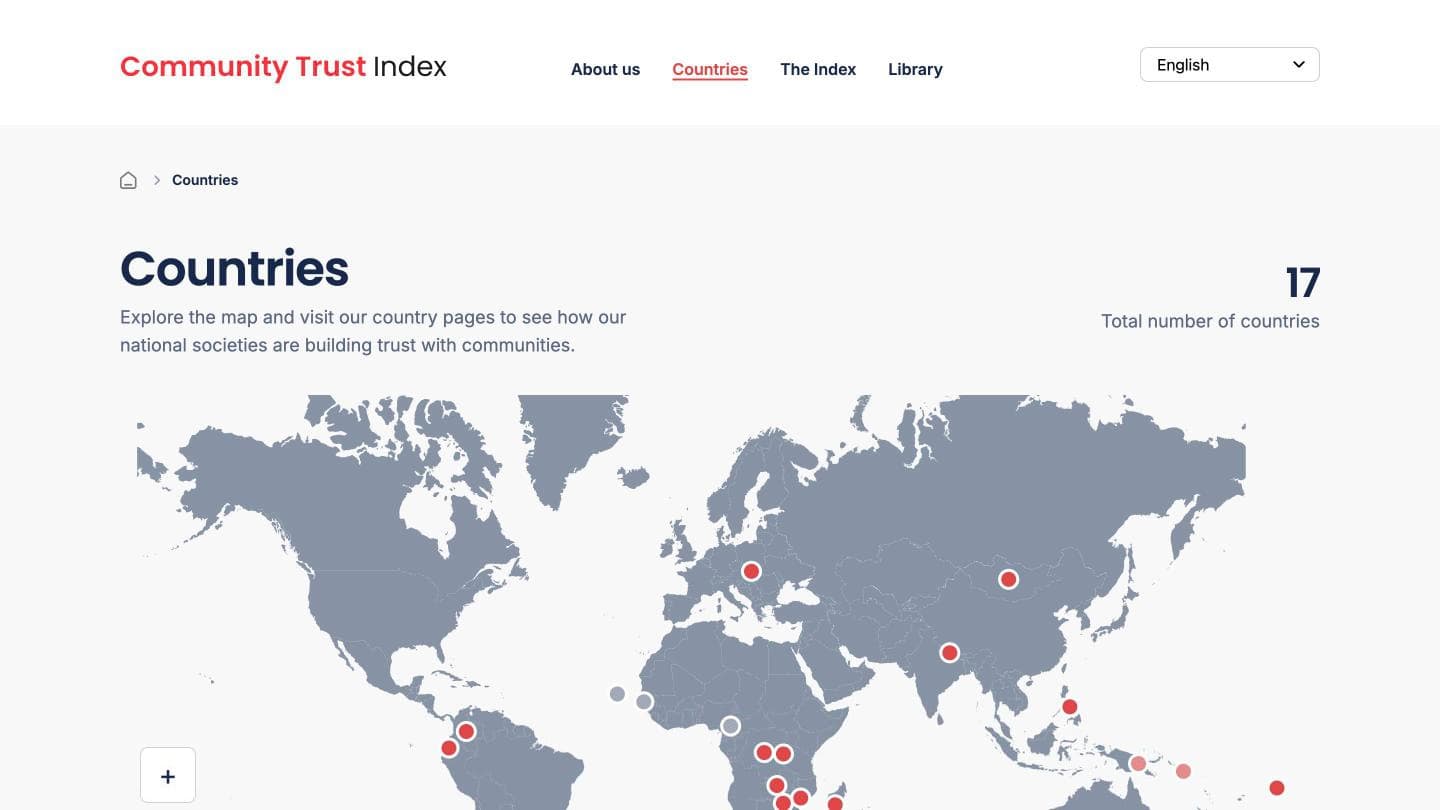
 New site · Countries
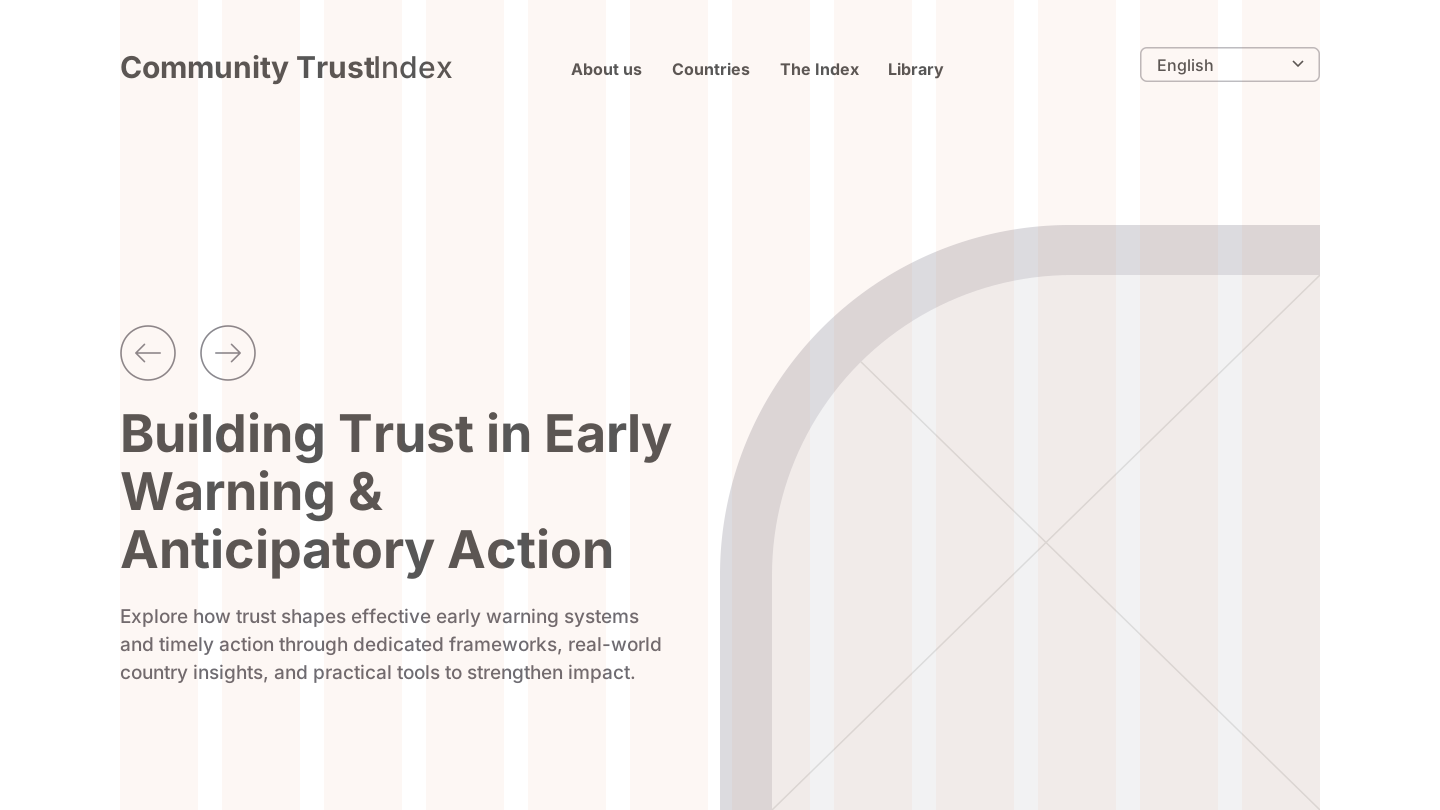
 Detailed wireframe

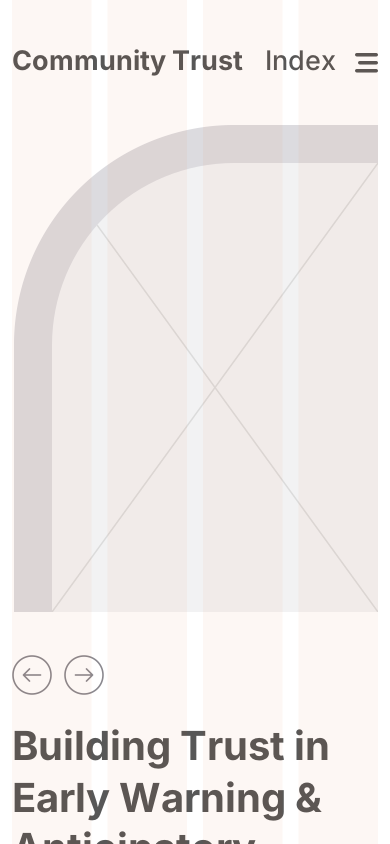
 Rough wireframe
- Country reports on the site, up from at least five pages in August 2024, all on the same page design
- 14
- Study types, Institutional and Early Warning, sharing one page so a country stays in one place
- 2
- Languages, so results can reach teams who don’t work in English
- 4
How it came about
Trust decides whether people act on what humanitarian organisations tell them. The Community Trust Index measures that trust. It was developed by the IFRC’s Community Engagement and Accountability unit as an evidence-based tool for organisations and the communities they serve.
By early 2024 the results were tracked in a spreadsheet. That worked for the research team and for nobody else. National Societies run the survey, but programme teams and leaders need to read the results and act on them, and a spreadsheet can’t do that.
The Index needed a home of its own, so we designed and built one from scratch.
The research
The site’s structure comes from the method it has to explain. Before drawing a page, we had to understand how a trust score is made and who reads it.
How the score works
Answers from several survey questions convert to a common scale of 1 to 10, where 10 is the highest trust. “Don’t know” answers are left out so they don’t affect the result. Question areas then combine into one figure, with the more central aspects of trust given more weight. So the site has to show that single figure and also what sits behind it.
Why one number is not enough
Trust is measured through competencies and values, so a page can’t stop at a score. A reader has to see which part of trust is strong and which is weak.
Why countries need more than one study
Some countries measure trust in the institution. Others measure trust in early warning systems, across four pillars from risk knowledge to response. A country can have both, so the page had to hold more than one study.
Why time matters
Surveys repeat, so a country needs more than one year on a page, and a way to see the change between them.
The design
The design had to do two things: make a research method readable, and make it clear that this tool belongs to the movement that uses it.
Why the map comes first
The first question a reader has is whether their country is there, and the first thing a global index has to prove is its reach. The Countries page follows the order the computer scientist Ben Shneiderman set out in 1996 for reading large sets of information: overview first, then zoom and filter, then details on demand. The map gives the overview, the filter narrows it to one study type, and each country page holds the detail. On a phone a world map shrinks past the point of use, so the page leads with the list of reports instead.
Why every country uses the same page
Overview, key insights, overall score, then the detail, in that order every time. Edward Tufte’s work on repeated designs explains why: when the layout stays constant, readers stop learning the page and start noticing the data. Someone who has read Zambia can read Nepal, and the differences they see are differences in trust, not in design.
Why a switch and not a second page
Nepal has both an Institutional and an Early Warning study. A simple switch moves between them, with tabs for each year and for trends, so a country stays in one place as its evidence grows.
Why navy and red
The colours align the Index with the Red Cross and the IFRC, so readers inside the movement recognise it as theirs. Red is kept for emphasis: the key words in a headline and the markers on the map. Navy on white reaches a contrast of 14.6 to 1 and body text 5.6 to 1, both well past the 4.5 to 1 that WCAG AA asks for. The red reaches 4.1 to 1, which meets the 3 to 1 for large text, so it stays on large headings and never carries body text.
Why people come first, in a soft shape
The home page opens on a person, not a chart, because trust is about people. The photograph sits in an arch rather than a hard box. In a 2006 study, Moshe Bar and Maital Neta found that people prefer curved objects to sharp-angled ones, which suits a page about trust.
The wording
The findings were written with the research team, partly from the data in the sheets.
Why findings are sentences
They are statements, not chart labels: “Transparency is the clear trust gap” and “Receiving support does not automatically translate into high trust”. A leader can repeat a sentence like that in a meeting, and a reader who only skims the page still leaves with the finding.
Why the site names its readers
The home page speaks to two groups directly: “For programs & operations” and “For leadership”. Each can find what is meant for them without reading the method first.
The build
Build a custom theme
The site runs on a custom WordPress theme, not a template. A map, country data and modules are too specific for a theme bought off the shelf.
Keep content in structured forms
Countries, modules and findings go into fields, not page designs, so every new report takes the same shape without design work.
Read the spreadsheet that already exists
The research team’s Google Sheet already held all the data, so the charts read from it directly. Nothing had to be rebuilt or entered twice, which kept the cost down.
Draw the map from geographic data
Each country on the map has a marker and a link to its page, so the map works as the site’s main way in.
The result
The site grew without a redesign. A public archive copy shows at least five country pages in August 2024. There are 14 country reports today, and 17 countries on the counter.
It is in active use: seven of the 14 reports are dated between November 2025 and June 2026, from Slovakia to Madagascar. Early Warning joined Institutional with the same page structure, and Nepal now carries both.
The evidence behind it is large and specific. In Nepal, 5,309 people took part in the Early Warning survey, and 4,958 were included in the analysis.
What we learned
- Use what already exists. Reading the team’s own spreadsheet saved money and kept the researchers working in a tool they knew.
- Keep a copy of anything you depend on. A site that reads an outside file inherits that file’s risks. On the next build, the site would keep its own regular copy of the data.
- Design for the next study, not this one. A page built around one study would have needed rebuilding. A page built around a country took a second study without trouble.
Standards met
- Text contrast
- Calculated from the site’s own colours: navy on white 14.6 to 1, body text 5.6 to 1, and red 4.1 to 1, used for large text only.
- Languages
- English, French, Spanish and Portuguese.
- Editing
- Countries, studies and findings are entered in forms on a custom WordPress theme.
- Automated scores
- None on record. The site’s firewall blocks automated test tools.
Sources
- Shneiderman, The Eyes Have It: A Task by Data Type Taxonomy for Information Visualizations, IEEE Symposium on Visual Languages, 1996
- Tufte, Envisioning Information, Graphics Press, 1990
- Bar and Neta, Humans prefer curved visual objects, Psychological Science 17(8), 2006
- W3C, Web Content Accessibility Guidelines (WCAG) 2.2, 2023
Team
- Project lead
- Matthew Bowman
- Client team
- IFRC Community Engagement Hub
What this platform could carry next
What this proves
We use what already works.
The research team’s spreadsheet already held the data, so the site reads it directly and nothing was rebuilt.
We design for what comes next.
One page design took a second study type and now carries 14 country reports.
We turn numbers into sentences.
Each country page says what the results mean in plain words, written with the research team.
Contact
Send us the brief.
A rough brief or a terms of reference is enough. Matthew Bowman replies the same business day, and you have a fixed-fee proposal within five working days.